
To save you time and make things easier for you to select the right tool for improving the app performance with reporting and data visualization features, we are presenting the JavaScript data visualization libraries to simplify working with data.
Selecting the appropriate style to display your data in a readable manner can prove to be a difficult task sometimes. And here comes data visualization to our rescue, which can easily deliver the information of the conducted data analysis.
If you happen to have a look around yourself, you will find that almost every application we build requires or leverages data to enhance the functionality provided to the users.
Often, the most amazing thing we can offer to our customers is the data itself. That being said, table and number charts are always exhausting to interpret and it can be difficult to draw enforceable conclusions from huge data tables.
Therefore, we can use efficient data visualization approaches that enhance the brain’s ability to recognize and analyze data visually.
Data visualization can be both an art as well a science. There is an infinite number of data visualization tools available today. Therefore, finding the right one for you can prove to be a time-consuming job.
In this article, we have rounded up some of the best JavaScript data visualization libraries for 2021.
Read on to know about the top 15 JavaScript data visualization–
Top 15 JavaScript Data Visualization
1. D3.js
D3 is a JavaScript data visualization library that is mostly used to manipulate documents based on data. This library uses web standards and does not care whether you use React, Vue, or some other JavaScript framework.
D3 is one of the most popular JavaScript data visualization libraries as a lot of other libraries are also D3 based. D3 operates with selectors jQuery-like to select DOM components, which are typically SVG but can also be a canvas.
D3 is an enormously popular visualization tool that helps in creating interactive data visualizations. To construct data visualization, it uses modern web standards: SVG, HTML, and CSS. With D3, no standard visualization formats are required. But it allows users to build graphs, HTML tables, geospatial maps, and bar & pie charts.
Features of D3
- It is declarative programming.
- Data-driven
- Highly robust and flexible.
- Fast and quite easy to use.
- Supports large datasets.
- Provides the transition() function.
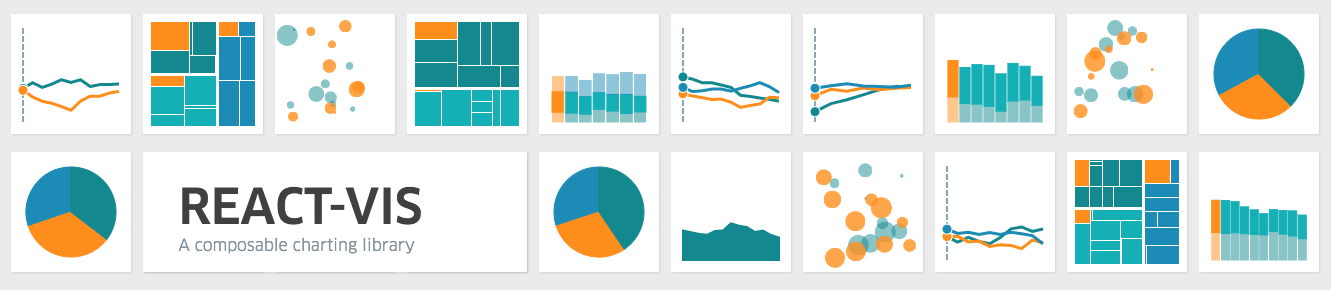
2. React-vis
React-vis is a library developed by Uber for React visualization. Uber is currently the largest organization that supports a data visualization library.
This React-vis library is extremely simple to install and use, and has outstanding documentation that is backed by Uber. With it, popular charts such as line, area, bar charts, pie charts, treemaps, and many others can be created quickly.
JavaScript Interview Question And Answer For 2021
The library doesn’t need any prior knowledge of D3 or any other data visualization library and offers modular low-level building block elements such as the X/Y axis. A good fit and a very convenient library to consider for working with Bit.
Features of React-vis
- It is simple to use and does not require deep knowledge of data visualization libraries.
- It is flexible, robust, and offers a set of basic building blocks.
- Easy to use and offers a set of defaults that can be overridden by the custom user’s settings.
- Integrates well with React.
3. Chart.js
Chart.js is an open-source JavaScript data visualization library on Github that enables you to use the HTML5 canvas feature to draw various types of charts.
Because it needs canvas, you have to use a polyfill to support older browsers. Chart.js gives you 6 major chart types by default, it facilitates usability, and is easy to understand by a beginner. It is lightweight and has completely responsive charts like Bar, Bubble, Doughnut, Line, PolarArea, Radar, Scatter, and Pie.
To incorporate various datasets, you can conveniently try mixing up the different line and bar charts, which prove to be of amazing quality. It can be an ideal library if you are working around huge datasets.
Features of Chart.js
- Free of cost
- Open-source
- Built-in charts
- It is extendable to custom charts.
- Supports modern browsers.

4. VX
VX is a set of low-level visualization components that are reusable. For updating the DOM, Vx leverages the functionality of D3 to produce your visualization with the beneficial effects of React.
The aim is to build a component library that can be used to construct a reusable chart library and a custom one-off chart. VX is essentially unopinionated and is a collection of reusable low-level visualization components. Retain the sizes of your bundle down and just use the packages you require.
Underneath the surface, VX uses d3 for calculations and math. If you build your amazing chart library on top of VX, it’s simple to create an API component that fully hides D3. This means that the team can build charts as effectively as using reusable react com.
Features of VX
- Easy to access and make complex graphs
- Great API
- Better browser support
- Provides more shapes.
- Offers unique animations and transitions.
- Easy interactions
5. ReCharts
Under the hood, Recharts uses D3 and demonstrates declarative components. It’s fairly light and renders SVG elements to build stunning, interactive charts.
Charts can be modified and you can have a look at some of the examples given by the library itself. Static charts provide a great output and include built-in general charts resources such as legend tooltips and labels.
JavaScript Compiler Improved Google Chrome 91
When coping with several animated charts within the same page and huge datasets, it can get glitchy, but it might still work for most use cases. A large number of unanswered challenges on GitHub is a little concerning.
These problems may not be important, but it seems that creators do not stop by often enough to address them. So, if you do get trapped, make sure you know how to come out of it.
Features of ReCharts
- It can quickly build your charts with decoupled, reusable React component
- Lightweight and reliable
- Composable chart elements.
- Powerful, responsive with an intuitive API
6. TradingVue.js
TradingVue.js is a hackable charting library especially made for individuals who trade You can practically draw everything on top of the candlestick charts. If you build apps for trading, build custom indicators, and think ahead of time this is most likely the best library for you.
The library offers functions that map your data to screen coordinates. Behind the scenes, this library does all the real work like scrolling, scaling, reactivity, etc.
Features of TradingVue.js
- You can perform functions like scrolling & zooming as you want.
- It has a basic API for making new overlays.
- Provides custom drawing tools
- Completely reactive and responsive
- Customizable colors and fonts.
- Pretty fast (works even with 3 mil candles)
7. Victory
A collection of components for modular charting made especially for React and React Native. Victory does a decent job of making a chart by offering fundamentals.
Concepts like customizing axes, and labels, and using a distinct data set for a particular graph are all relatively simple, and tweaking styles and behavior is simple and convenient.
It’s certainly worth checking out for cross-platform applications and allows you to create some nice-looking graphs with relatively low code.
Features of Victory
- It has easy-to-use components for complex charting.
- A reusable data visualization element is used for its styles and behaviors.
- Robust & flexible.

8. Echarts
It is a visualization library for the browser Baidu’s e-Charts project. It’s composed in proper JavaScript and is made around the zrender canvas library. It supports rendering charts in the manner of Canvas, SVG (4.0 +), and VML in addition to PCs and web browsers, e-Charts could also be used for powerful server-side rendering (SSR) with node-canvas on the node.
FrontEnd JS Framework To Learn
The basic chart types eCharts has been providing several charts– from bar series to heatmap to box lot to candlestick and much more.
Features of E-charts
- Optimized for mobile interaction making zoom function easier for you.
- Displays the visualization of a whole lot of data.
- It has been on the road of interaction.
- Supports multi-dimensional data.
- It revolves around data and any change on the data drive will alter the chart.
9. Highcharts
Highcharts JS is a popular SVG-based JavaScript charting library, with VML and canvas fallbacks for old browsers. It says that is being used by 72 of the 100 largest corporations in the world making it quite a popular JS charting API.
It provides a huge range of supported chart types, including all the popular charts like error bars, waterfall, angular gauges, bar, pie, and much more. It does not cost anything for non-commercial users, which includes personal projects, university websites, and organizations that are known to be charitable and non-profit.
Features of Highcharts
- The Highcharts Debugger will make the development process to be quick.
- It provides proper mobile friendliness.
- Free for non-commercial users.
- Open Dynamic API
- Data is produced in CSV, JSON, or loaded form.
10. Frappe Charts
It is a very basic library for charts with zero dependencies. Frappe Charts is a GitHub-like visuals-inspired package that supports line, bar, and various chart styles.
You can also choose to build heatmaps every month you can learn from GitHub Activity. It is open-source and a pretty lightweight package.
Features of Frappe Charts
- Easy to use
- SVG based
- It is responsive
- It has a small bundle size.

11. Nivo
Nivo is a unique framework developed on top of React & D3, offering 14 various components to display your data with. It was launched in 2017 and featured on ProductHunt as the product of the day on 20th August 2017. Nivo provides several customization choices and 3 ways to render: SVG, Canvas, and HTML.
The documentation is excellent and the demonstrations are enjoyable and customizable. It is a high-level library and very easy, but it provides less custom visualization ability.
Features of Nivo
- Highly customizable
- Exhaustive documentation
- It has motion/transitions that are driven by react-motion.
- It is extremely responsive.

12. Google Charts
An immensely renowned tool for charts that deserved a place in this article. It is a useful JS library as it offers several forms of charts like geo, area, bar, and so on. It is free but is not open-source. By far, it is not responsive, albeit with the use of some code you could allow it to resize charts.
Based on the chart type, there are numerous customization choices, but it might not be necessarily beginner-friendly. And, rather than just an NPM package, you have to load it straight from a Google URL.
Features of Google Charts
- It has a rich gallery
- Provides customizable options.
- It has HTML/SVG properties.
- Offers free chat tools, dashboards, and controls.
- Allows modifying the chart even after chart generation.
JavaScript Vs Dart For Cross-Platform Mobile Apps Development
13. CanvasJS
Another popular tool that offers beautiful charts on various computers and browsers is CanvasJS. You might find that a lot of charts are not present here, such as gauge charts and network charts.
Also, it might take some time to understand it. On the other hand, it is very easy, works seamlessly with as many as 100k+ data points, and offers four default designs for matching up with most environments. Their list of customers is also very impressive- from Apple to Microsoft to HP to Siemens and many others.
Features CanvasJS
- It is lightweight and offers high performance.
- Provides a wide range of customizable charts.
- It is a tablet and mobile-ready.
- Runs seamlessly on Chrome, Firefox, Safari, IE8+
- It offers beautiful-looking charts.
14. ZoomCharts
It is another one of the most popular JavaScript data visualization libraries. Besides reactivity, it focuses mainly on multi-touch gestures and a native experience across all sorts of devices. The library offers beautiful visualizations that require minimal code and can be implemented effortlessly on your device.
Zoom charts are based on Canvas, and the library runs up to 20x quicker with default settings than its SVG-based counterparts, making use of the same data and settings.
Features of ZoomCharts
- You can create visually rich and interactive charts for your application.
- Easy to use and learn.
- It requires a minimal amount of code.
- Lets the users discover new insights.
15. ThreeJS
Three.js is known to be a cross-browser JavaScript library and application programming interface (API) that is used to build and render animated 3D computer graphics using WebGL in a web browser.
The versatile and intuitive scale of the work implies that it is also beneficial for visualizing details in 2 or 3 dimensions. For instance, for 3D graph visualization with WebGL, you can make use of this designated module.
Features of ThreeJS
- You can add and remove objects at run-time.
- It allows the creation of a graphical processing unit (GPU)-accelerated 3D animations.
- Runs on all browsers supported by WebGL 1.0.
Bottom Line
We are definitive that this list of JavaScript data visualization libraries will help you a lot in understanding a great deal about these libraries as well as selecting for improving your app as much as you can.
All of these libraries are excellent and there are minor variations between each one of them, such as the size of the library, the unique use of APIs, and the prominence of GitHub.
Like this blog? Codersera makes sure that you stay updated with the trends and technologies going around in the market.
Also, did you know that Codersera has been helping companies to Hire highly qualified JavaScript developers? The developers go through a strict process for selection and only then they are hired.