Codersera


14 min to read
Python for Data Science: Beginners Guide to Master Data Science 2026
Learn Python for data science from scratch with our comprehensive 2026 guide. Master Pandas, NumPy, Polars, and LLM integration with real-world projects and career guidance.
Why Python Remains the King of Data Science
Five years into your journey as a professional, you realize something: the tools matter far less than understanding the why behind the data. Python isn't just a programming language—it's the linguistic bridge between raw data and human insight.
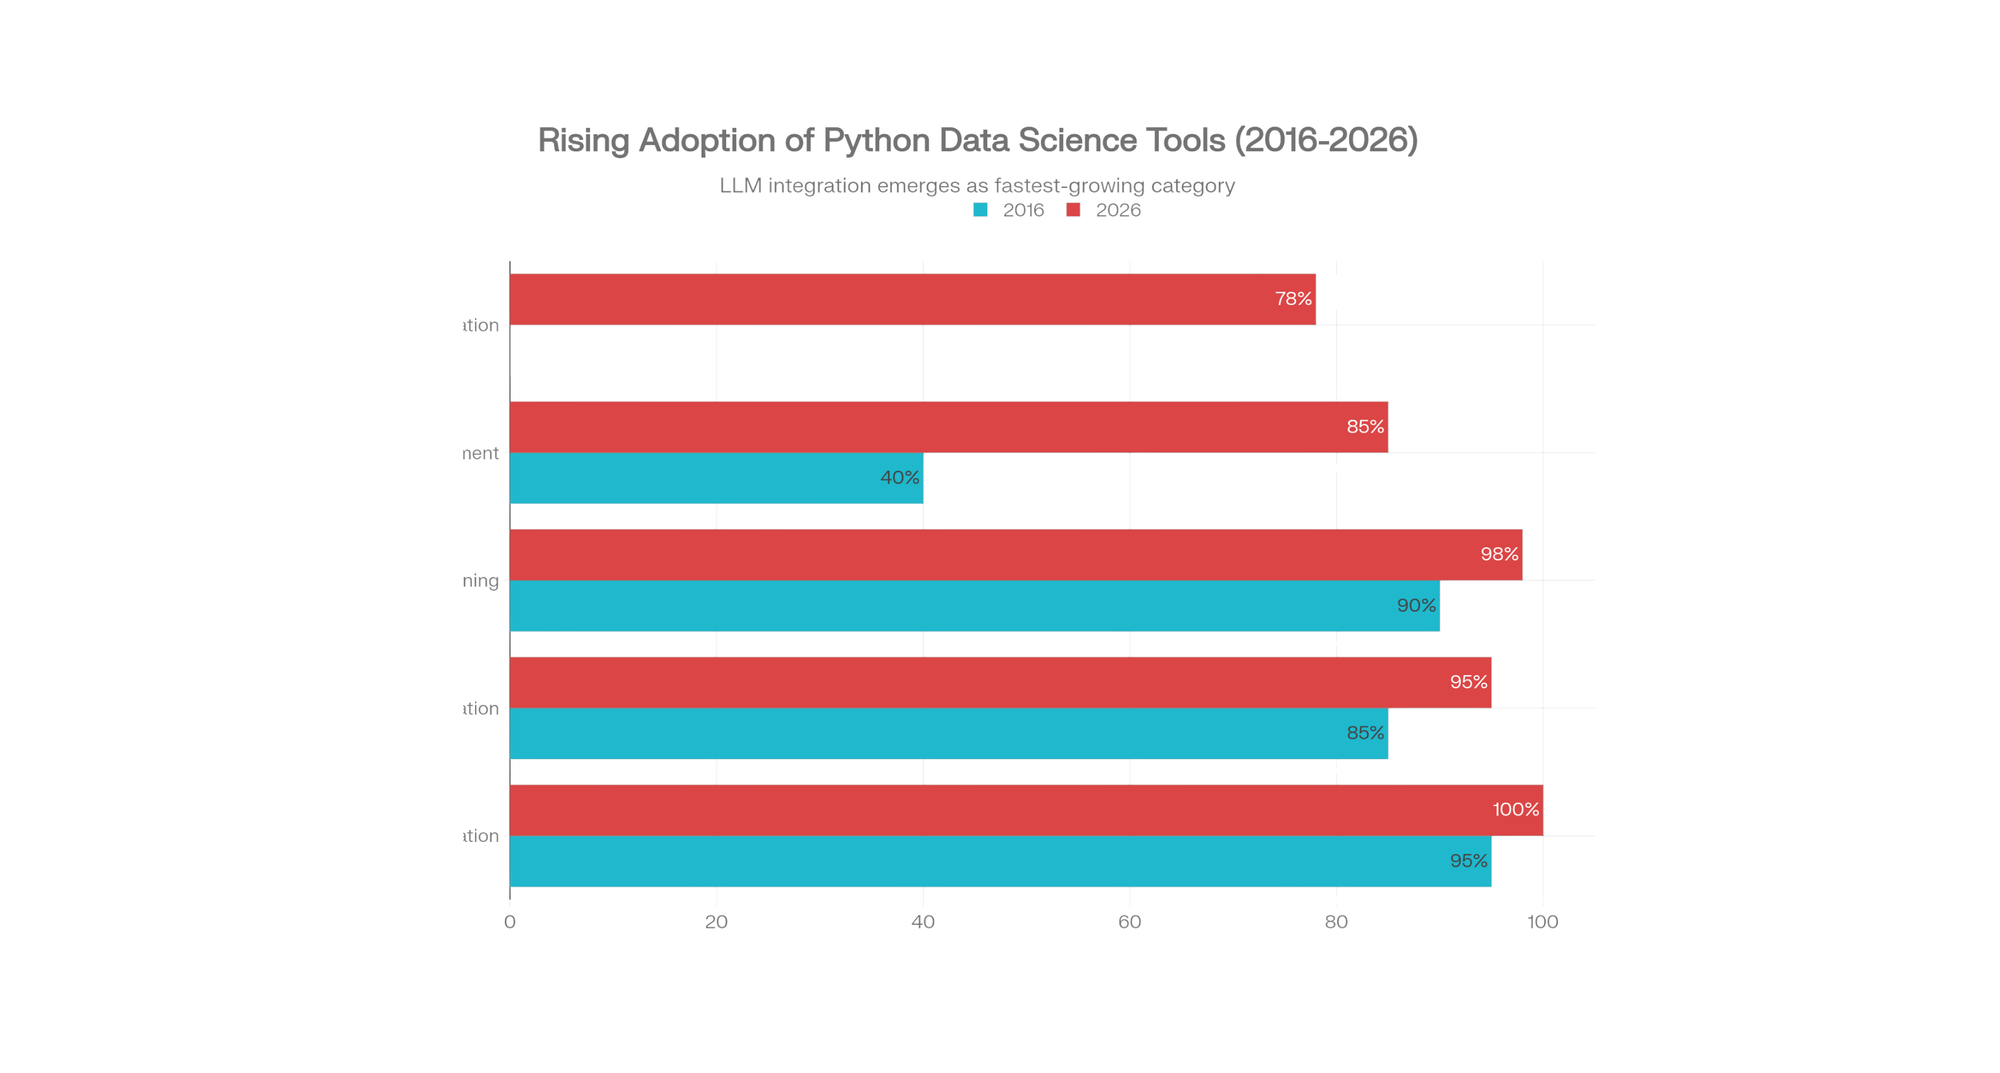
In 2016, the average Analytics Vidhya tutorial taught Pandas, NumPy, and Scikit-learn as the complete toolkit. Today in 2026, the landscape has evolved dramatically. You're not just cleaning data and building models anymore. You're integrating Large Language Models (LLMs) into your workflows, deploying models to production with MLOps pipelines, and competing with engineers who understand both data science and software engineering principles.
But here's the beautiful part: Python has become more accessible, not less. The fundamentals remain unchanged. Yet the opportunities have exploded.
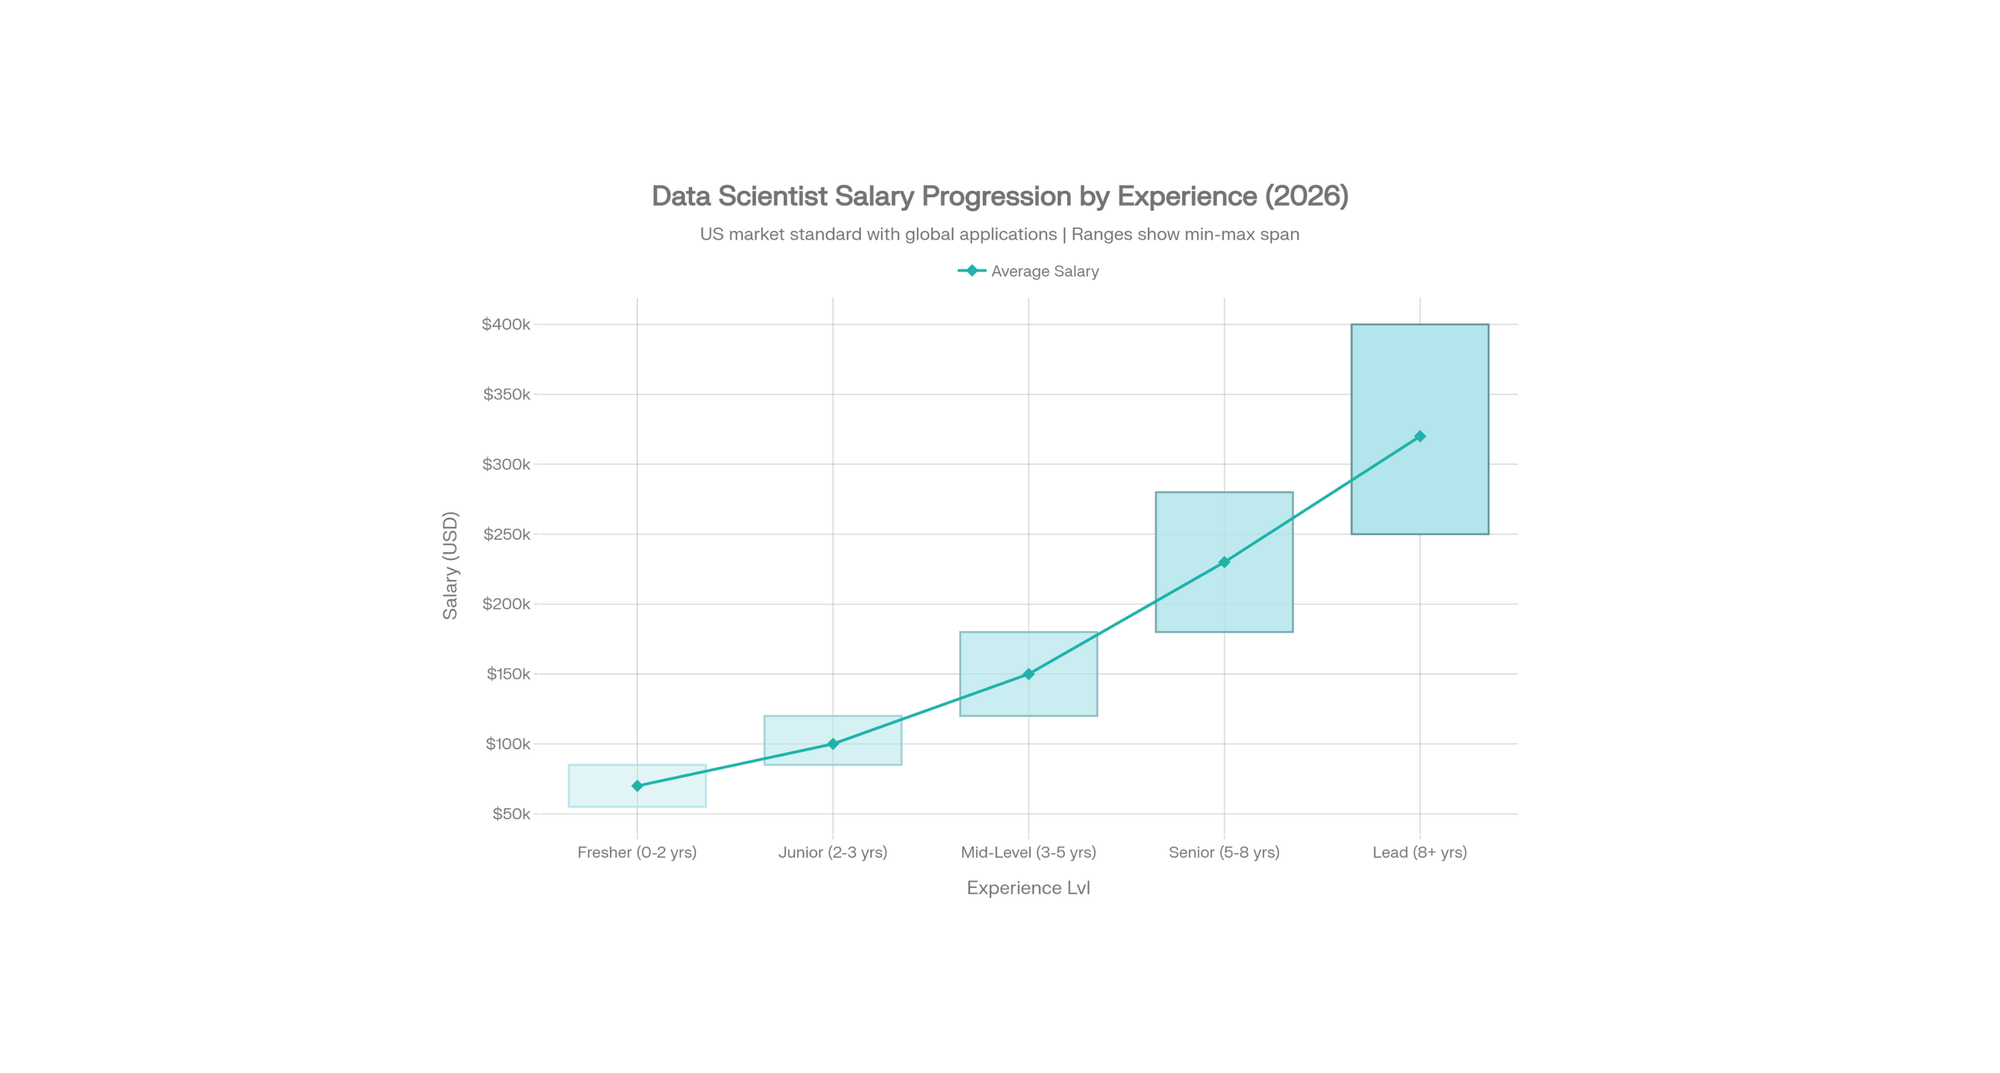
According to recent 2026 salary data, a junior data scientist and a python developer in the United States earns $85,000–$120,000, mid-level professionals command $120,000–$180,000, and senior data scientists with GenAI/LLM expertise earn $180,000–$280,000 or beyond.
The differential isn't just experience—it's the willingness to master modern tooling. (Equivalent ranges globally: Europe €70K-$250K, India $8K-$30K, Asia-Pacific $15K-$120K, adjusted for local markets).
This guide is for you if you're starting from scratch, or if you've learned the basics and want to understand what actually matters in 2026. We'll move beyond notebooks and explore production-ready systems, modern libraries, and practical projects that build real portfolios.
Part 1: Python Fundamentals for Data Science
Why Python for Data Science?
Three reasons dominate:
Open-Source Ecosystem. Python's richness lies not in the language itself but in its libraries. NumPy handles numerical computing. Pandas transforms data. Scikit-learn trains models. Unlike SAS or SPSS (proprietary tools costing thousands), Python costs nothing and welcomes contribution from 3+ million developers worldwide.
Readability Over Syntax. Unlike Java's verbose syntax, Python reads like English. This matters when debugging at 2 AM or explaining your model to a non-technical stakeholder.
Unified Workflow. In 2026, you might prototype in Jupyter, test in VS Code, deploy with FastAPI, and monitor with Python-based MLOps tools. The entire pipeline speaks one language. This coherence saves months of integration headaches.
Setting Up Your Environment (2026 Best Practice)
Most beginners skip this, then lose weeks troubleshooting library conflicts. Don't.
Step 1: Choose Your IDE
| IDE | Best For | Key Feature |
|---|---|---|
| Google Colab | Beginners, GPU access | Free, cloud-based, instant Python 3.11 |
| Jupyter Notebook | Interactive exploration | Cell-based, Markdown integration, reproducible |
| VS Code | Production projects | Full IDE, Git integration, debugging |
Recommendation for beginners: Start with Google Colab. Zero setup, free GPU for training models, instant collaboration links.
Step 2: Create a Virtual Environment
Why? Imagine Project A needs pandas 1.3, but Project B needs pandas 2.0. Without virtual environments, they conflict. You'll waste days debugging "but it worked yesterday."
Using Conda (recommended for data science):
bashconda create -n datasci python=3.11
conda activate datascipip install pandas numpy scikit-learn matplotlib jupyter
This isolates your project's dependencies. When switching projects, you simply conda activate the appropriate environment.
Step 3: Install Core Libraries
| Library | Purpose | 2026 Context |
|---|---|---|
| NumPy | Numerical computation | Foundation for all math operations |
| Pandas | Data manipulation | Standard, but Polars now faster for big data |
| Polars | High-performance dataframes | New standard for datasets >5GB |
| Matplotlib/Seaborn | Static visualization | Exploratory analysis |
| Plotly | Interactive dashboards | Stakeholder presentations |
| Scikit-learn | ML algorithms | Classification, regression, clustering |
For 2026 workflows, you'll install both Pandas and Polars. When should you use which? Pandas for datasets under 5GB and when flexibility matters. Polars when handling gigabytes and performance is critical.
Part 2: Data Structures & Core Concepts
Lists, Tuples, Dictionaries
python# Lists: mutable, ordered
numbers = [1, 2, 3, 4, 5]
numbers.append(6) # Can be changed
# Tuples: immutable, ordered (faster for fixed data)
coordinates = (40.7128, -74.0060) # Can't modify
# Dictionaries: key-value pairs (perfect for structured data)
user_profile = {
'name': 'Ananya',
'age': 28,
'city': 'Bengaluru',
'skills': ['Python', 'ML', 'SQL']
}
Critical insight for beginners: Strings are immutable. Lists are mutable. Tuples are immutable but hold mutable objects. Dictionaries scale beautifully for complex data. This distinction will save you from subtle bugs later.
Iteration & Conditional Logic
Most beginners write slow loops. Avoid this:
python# SLOW: Iterates row-by-row
result = []
for value in large_dataset:
if value > 100:
result.append(value * 2)
# FAST: Vectorized operation (100x faster on 1M rows)
result = large_dataset[large_dataset > 100] * 2
In 2026, vectorization isn't optional—it's essential. Why? Because Pandas, Polars, and NumPy leverage C-level optimizations. Python loops are interpreted, slow, and won't scale.
Part 3: Modern Python Libraries for Data Science (2026 Edition)
NumPy: Numerical Computing Foundation
NumPy creates n-dimensional arrays and supports mathematical operations. It's the foundation—everything else builds on NumPy.
pythonimport numpy as np# Create arraysT
matrix = np.array([[1, 2, 3], [4, 5, 6]])
# Matrix operations (C-level speed)
transposed = matrix.inverse = np.linalg.inv(matrix)
# Broadcasting (multiplying arrays of different shapes)
scaled = matrix * 2
Use case: Stock price calculations, image processing (images are matrices), scientific simulations.
Pandas: Data Wrangling & Exploration
Pandas introduced DataFrames—table-like structures with row/column labels. It's how 99% of data scientists prepare data.
pythonimport pandas as pd# Read data (many formats: CSV, Excel, SQL, JSON)
df = pd.read_csv('loan_data.csv')
# Exploration
df.head() # First 5 rows
df.describe() # Statistical summary
df.isnull().sum() # Missing values
# Data cleaning
df['Income'].fillna(df['Income'].median(), inplace=True) # Fill nulls
df = df[df['Age'] > 18] # Filter rows
# Aggregation
avg_income = df.groupby('Location')['Income'].mean()
Polars: The 2026 Performance Upgrade
Polars is to Pandas what turbocharged engines are to standard engines. Written in Rust, it uses lazy evaluation and parallel processing.
Benchmark (54 million row CSV):
- Pandas: ~70 seconds, high memory
- Polars: ~8 seconds, 37% less energy consumption
pythonimport polars as pl# Polars syntax is similar to Pandas but faster
df = pl.read_csv('large_dataset.csv')
# Lazy evaluation (not executed until .collect())
result = df.filter(pl.col('price') > 1000).select(['id', 'price']).collect()
When to use Polars: Datasets > 5GB, production pipelines, big data scenarios. For beginners on small datasets, Pandas remains sufficient.
Scikit-learn: Machine Learning Simplified
Scikit-learn provides ML algorithms with a unified API. Want to try 10 models? Change one line.
pythonfrom sklearn.model_selection import train_test_splitfrom sklearn.ensemble import RandomForestClassifierfrom sklearn.metrics import accuracy_score# Split data
X_train, X_test, y_train, y_test = train_test_split(X, y, test_size=0.2)
# Train model
model = RandomForestClassifier(n_estimators=100)
model.fit(X_train, y_train)
# Evaluate
predictions = model.predict(X_test)
accuracy = accuracy_score(y_test, predictions)
print(f'Accuracy: {accuracy:.2%}')
Matplotlib & Seaborn: Visualization
Matplotlib creates static plots. Seaborn makes them beautiful with one-liners.
pythonimport matplotlib.pyplot as pltimport seaborn as sns# Seaborn plot (defaults to better aesthetics)
sns.histplot(data=df, x='Income', bins=50, kde=True)
plt.title('Income Distribution')
plt.show()
Part 4: The 2026 Differentiator—LLM Integration in Data Science
This is the game-changer most tutorials missed.
Why LLMs Matter for Data Scientists
Data cleaning consumes 70% of a data scientist's time. In 2026, LLMs automate this:
Natural Language Queries: Instead of writing Pandas syntax, ask in English:
python# PandasAI example (pseudo-code) OpenAI
from pandasai.llm importllm = OpenAI(api_token="your_key")
agent = SmartDataframe("data.csv", config={"llm": llm})
response = agent.chat("What's the average income by city?")
# Generates SQL/Pandas automatically
Data Generation: Create synthetic datasets for testing:
python# Prompt to LLM: "Generate 100 rows of employee data with names, departments, salaries"
# LLM generates realistic, diverse synthetic data
Code Generation: LLMs write boilerplate Python:
python# Ask: "Write a Scikit-learn pipeline for classification with scaling and feature selection"
# LLM generates complete pipeline code
Model Explainability: LLMs translate SHAP/LIME outputs into business language:
python# Instead of: "Feature 5 has SHAP value of 0.23"
# LLM explains: "This customer's churn probability increased 23% due to reduced purchase frequency"
Top LLM Tools for Data Science (2026):
- LangChain: Connect LLMs to data pipelines and APIs
- LlamaIndex: Query structured data with natural language
- OpenAI/Gemini/Claude APIs: Fine-tune for domain expertise
- GitHub Copilot: AI-assisted code generation
Part 5: Exploratory Data Analysis (EDA) Workflow
Here's a real-world scenario: You receive a loan approval dataset. 614 applicants, 13 variables. Your job: predict loan approvals.
Step 1: Load & Inspect
pythonimport pandas as pddf = pd.read_csv('loan_data.csv')
print(f"Shape: {df.shape}") # 614 rows, 13 columns
print(f"Missing values:\n{df.isnull().sum()}")
Common issues: Missing values (handle with median/mode), outliers, inconsistent categories.
Step 2: Univariate Analysis (One Variable at a Time)
python# Numerical summary
print(df['Income'].describe())
# Histogram (distribution)
df['Income'].hist(bins=30)
# Categorical frequency
df['Gender'].value_counts()
Insight: If income is skewed (mean ≠ median), consider log transformation.
Step 3: Bivariate Analysis (Relationships Between Variables)
python# Correlation matrix (how variables relate)
print(df.corr())
# Loan approval rate by credit history
crosstab = pd.crosstab(df['Credit_History'], df['Loan_Status'], normalize='index')
print(crosstab)
# Output: Credit_History=1 → 80% approval, Credit_History=0 → 10% approval
This reveals signals: Credit history is a strong predictor of approval.
Step 4: Data Cleaning (The Messy Part)
python# Fill missing income with median (grouped by education level for sophistication)
df['Income'] = df.groupby('Education')['Income'].transform(
lambda x: x.fillna(x.median())
)
# Handle outliers (e.g., log transformation for skewed data)
df['Income_Log'] = np.log1p(df['Income'])
# Categorical encoding
df['Gender_Encoded'] = (df['Gender'] == 'Male').astype(int)
Part 6: Building Your First Predictive Model
Continuing the loan example:
pythonfrom sklearn.ensemble import RandomForestClassifierfrom sklearn.model_selection import train_test_split, cross_val_scorefrom sklearn.metrics import accuracy_score, confusion_matrix# Select features and targetfeature_importances_
features = ['Credit_History', 'Income', 'Loan_Amount', 'Employment_Years']
X = df[features]
y = df['Loan_Status'] # 1 = Approved, 0 = Rejected
# Split into train/test
X_train, X_test, y_train, y_test = train_test_split(X, y, test_size=0.2, random_state=42)
# Train model
model = RandomForestClassifier(n_estimators=100, random_state=42, max_depth=10)
model.fit(X_train, y_train)
# Evaluate
train_acc = model.score(X_train, y_train) # 85%
test_acc = model.score(X_test, y_test) # 78%
# Cross-validation (more robust evaluation)
cv_scores = cross_val_score(model, X, y, cv=5)
print(f"Cross-validation accuracy: {cv_scores.mean():.2%} (+/- {cv_scores.std():.2%})")
# Feature importance (what matters most)
importance = pd.DataFrame({
'feature': features,
'importance': model.}).sort_values('importance', ascending=False)
print(importance)
Key insight: Your test accuracy (78%) differs from training (85%)—this signals overfitting. Reduce model complexity or gather more data.
Part 7: Production Deployment & MLOps (What Sets You Apart)
The 2016 tutorial ends after model training. But in 2026, you must productionize your model.
Why MLOps Matters
Your model trained on January's data. February's customer behavior shifts. Your model drifts (predictions become inaccurate). MLOps automates retraining and monitoring.
Simple Deployment with FastAPI
pythonfrom fastapi import FastAPIimport joblibimport numpy as npapp = FastAPI()
# Load trained model
model = joblib.load('loan_model.pkl')
@app.post('/predict')
def predict(credit_history: int, income: float, loan_amount: float, employment_years: int):
"""Predict loan approval"""
features = np.array([[credit_history, income, loan_amount, employment_years]])
prediction = model.predict(features)
probability = model.predict_proba(features)
    return {
        'approval': 'Yes' if prediction == 1 else 'No',
        'confidence': f'{probability:.2%}'
    }

# Run: uvicorn app:app --reload
# Access: http://localhost:8000/docs
Version Control & Monitoring
pythonimport mlflow# Log model metrics
mlflow.start_run()
mlflow.log_metric('accuracy', 0.78)
mlflow.log_param('n_estimators', 100)
mlflow.sklearn.log_model(model, 'loan_classifier')
mlflow.end_run()
MLflow tracks versions, hyperparameters, and metrics—enabling you to revert if a new version performs worse.
Part 8: Career Roadmap & Real Salary Insights
United States Data Scientist Earnings (2026 Market Standard)
| Experience | Salary Range | Annual Increase | Key Skills |
|---|---|---|---|
| Fresher (0–2 yrs) | $55K–$85K | — | Python, SQL, basic ML |
| Junior (2–3 yrs) | $85K–$120K | +$35K avg | Pandas, Scikit-learn, EDA |
| Mid-level (3–5 yrs) | $120K–$180K | +$60K avg | Advanced ML, feature engineering, Spark |
| Senior (5–8 yrs) | $180K–$280K | +$100K avg | GenAI/LLMs, MLOps, Production systems |
| Lead (8+ yrs) | $250K–$400K+ | +$150K+ avg | Architecture, team leadership, strategy |
Global Context (Adjusted for Local Markets):
- Europe: €65K–€85K (Junior) → €150K–€250K (Senior)
- Canada: C$80K–$110K (Junior) → C$160K–$250K (Senior)
- Australia: A$100K–$140K (Junior) → A$180K–$300K (Senior)
- United Kingdom: £60K–£90K (Junior) → £130K–£200K (Senior)
- India: $8K–$12K (Junior) → $25K–$45K (Senior)
- Asia-Pacific (Singapore/HK): $60K–$90K (Junior) → $120K–$200K (Senior)
The US salary represents the global benchmark as most tech companies (FAANG, startups) offer US-equivalent compensation remotely.
Key Insight: The ₹$180K Jump
From $120K to $280K isn't just time—it's mastery of:
- Production ML systems (not Jupyter notebooks)
- GenAI/LLM integration (PandasAI, LangChain, RAG)
- MLOps (versioning, deployment, monitoring)
- System design at scale
12-Month Learning Path to $120K+ Role
Months 1–3: Fundamentals
- Python (OOP, functions, modules)
- NumPy, Pandas, Matplotlib
- Statistics basics (mean, variance, distributions)
Months 4–6: Data Science Core
- EDA workflows
- Scikit-learn (regression, classification, clustering)
- Feature engineering
- First portfolio project (loan prediction, house price forecasting)
Months 7–9: Advanced ML
- Time series (ARIMA, Prophet)
- Ensemble methods (Gradient Boosting, XGBoost)
- Model evaluation (cross-validation, hyperparameter tuning)
- NLP basics (TF-IDF, sentiment analysis)
Months 10–12: Production & Modern Tools
- FastAPI deployment
- Docker containerization
- MLOps (MLflow, DVC)
- GenAI integration (LLMs for data preprocessing)
- Second portfolio project (real-time prediction system)
Part 9: Common Mistakes & How to Avoid Them
1. Inadequate Data Cleaning
Mistake: Jump to modeling after removing nulls.
Reality: Missing values, outliers, and inconsistencies distort 80% of results.
Fix: Spend 40% of your time on EDA and cleaning. Use df.isnull().sum(), df.describe(), and visualizations.
2. Overusing For-Loops
Mistake:
pythonfor i in range(len(df)):
df.loc[i, 'Income_Log'] = np.log(df.loc[i, 'Income'])
Fix (50x faster):
pythondf['Income_Log'] = np.log(df['Income'])
NumPy vectorization is non-negotiable in 2026.
3. Ignoring Virtual Environments
Mistake: pip install globally, then wonder why Project A breaks Project B.
Fix: Always use conda create -n project_name.
4. No Version Pinning
Mistake: requirements.txt without versions. Scikit-learn updates, your code breaks.
Fix:
textpandas==2.0.3
numpy==1.24.2
scikit-learn==1.3.0
5. Not Splitting Train/Test Data
Mistake: Train and evaluate on the same data (inflates accuracy).
Fix: Always train_test_split(test_size=0.2). Even better, use 5-fold cross-validation.
Part 10: Real-World Portfolio Projects
Project 1: Customer Churn Prediction (Intermediate)
Dataset: Telecom customer data.
Goal: Predict who will cancel their subscription.
Key Concepts: Class imbalance handling, SMOTE, business metrics (precision/recall).
Time: 1 week.
Project 2: Stock Price Forecasting (Advanced)
Dataset: Historical stock prices.
Goal: Predict tomorrow's closing price.
Key Concepts: Time series (ARIMA, LSTM), feature engineering (moving averages, volatility).
Time: 2 weeks.
Project 3: End-to-End ML System (Expert)
Dataset: E-commerce transaction data.
Goal: Build a recommendation engine deployed as API.
Key Concepts: Collaborative filtering, matrix factorization, FastAPI, Docker, monitoring.
Time: 4 weeks.
Each project teaches:
- Real data (messy, incomplete)
- Proper evaluation metrics
- Deployment (not just training)
- Documentation & reproducibility
Part 11: The Polars & DuckDB Shift—Handling Bigger Data in 2026
When Standard Pandas Fails
You download a 12GB CSV. Pandas tries to load it entirely into RAM. Your laptop has 16GB. Memory fills, system freezes.
Polars Solution: Out-of-Core Processing
pythonimport polars as pl# Polars streams data (doesn't load entirely into RAM)
df = pl.scan_csv('huge_file.csv') # Doesn't execute yet (lazy)
result = (
df.filter(pl.col('price') > 100)
.group_by('category')
.agg(pl.col('price').mean())
.collect() # Only NOW does it execute efficiently
)
DuckDB: SQL on CSV/Parquet Files
pythonimport duckdb# Query CSV without loading into memory
result = duckdb.query(
"SELECT category, AVG(price) as avg_price FROM 'huge_file.csv' WHERE price > 100 GROUP BY category"
).to_df()
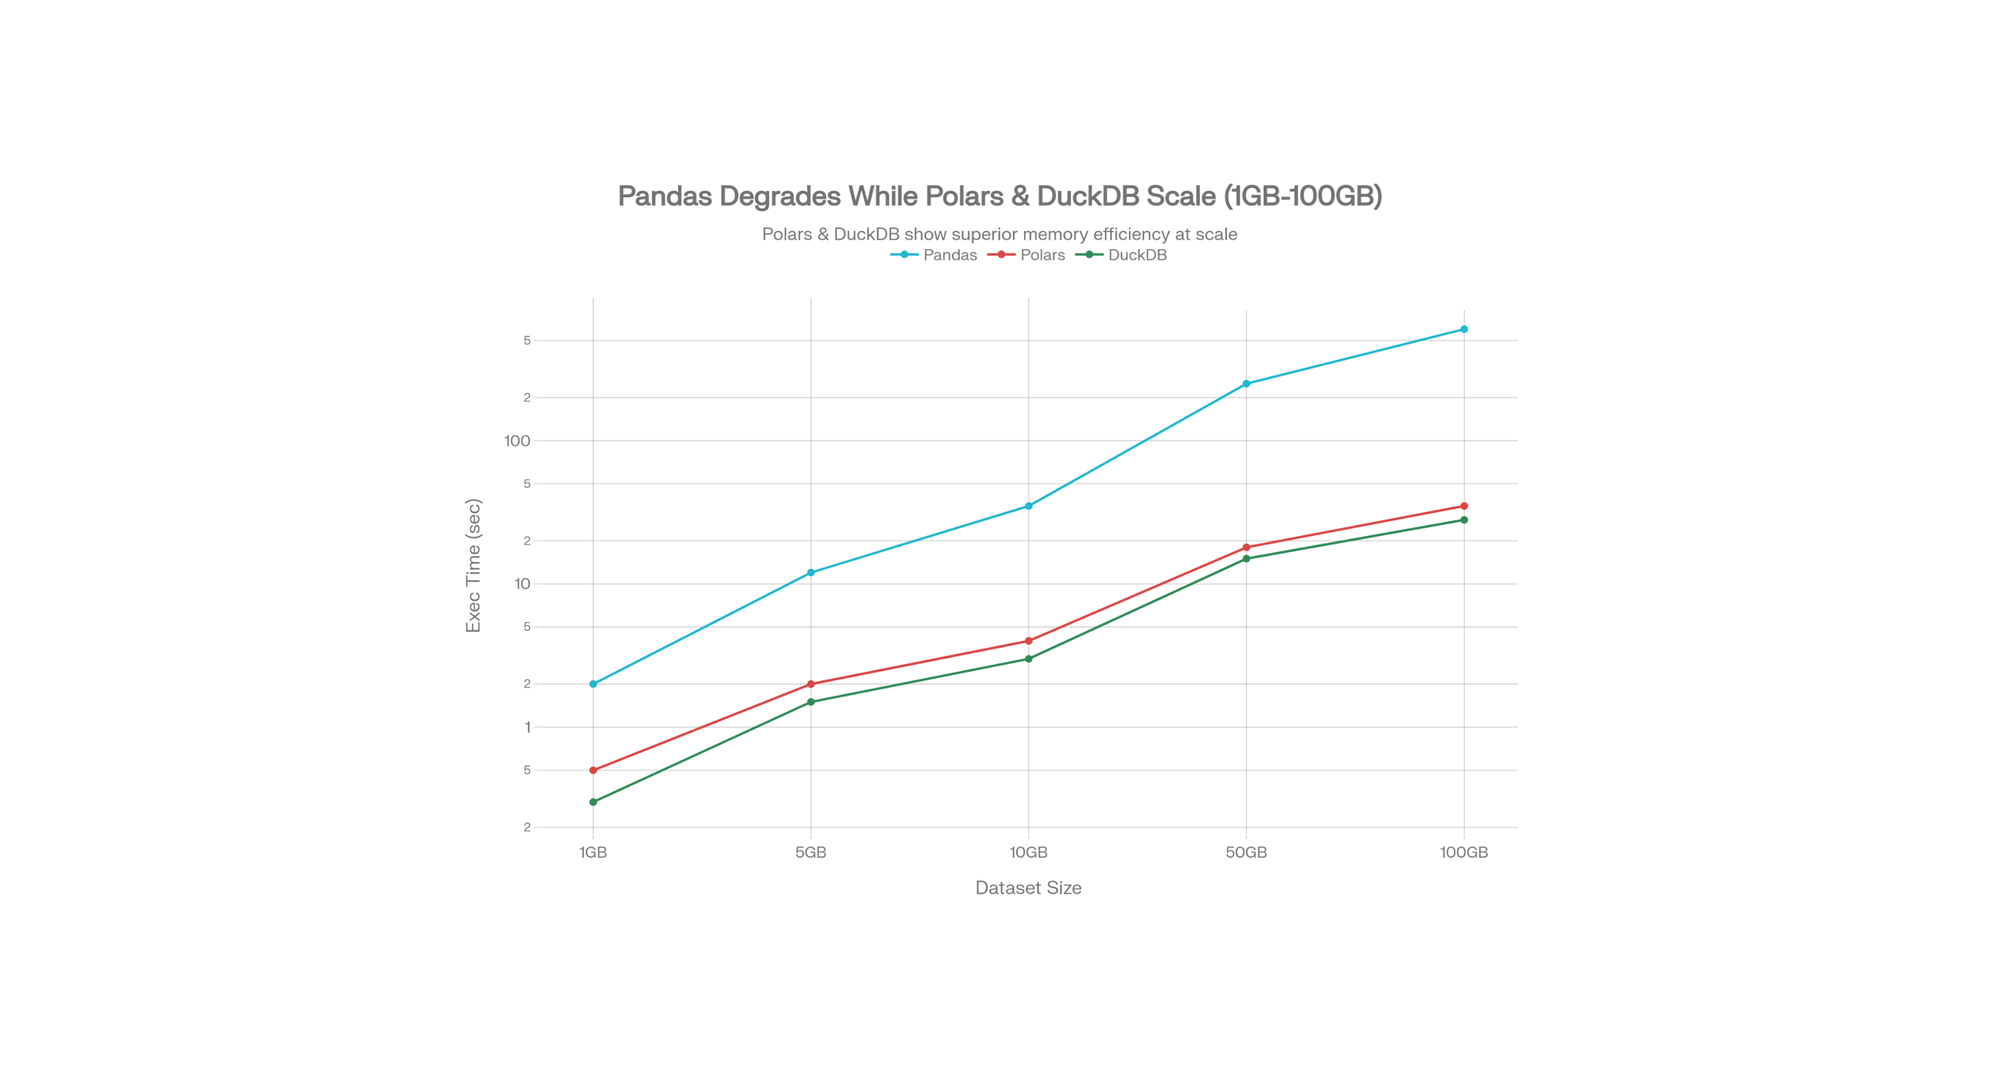
DuckDB Benchmarks (54M row CSV):
- Pandas: 70 seconds
- DuckDB: 8 seconds
- Polars: 6 seconds
In production, this difference = hours saved daily.
Part 12: LLMs & RAG Systems (The 2026 Frontier)
What is RAG (Retrieval-Augmented Generation)?
Traditional LLMs hallucinate (make up facts). RAG feeds an LLM your company's proprietary data, grounding it in truth.
Use case: Customer support chatbot that answers questions using your product documentation.
pythonfrom langchain.llms import OpenAIfrom langchain.vectorstores import FAISSfrom langchain.embeddings.openai import OpenAIEmbeddingsfrom langchain.chains import RetrievalQA# 1. Load your documents
documents = load_documents('company_knowledge_base/')
# 2. Split into chunks & embed
embeddings = OpenAIEmbeddings()
vector_store = FAISS.from_documents(documents, embeddings)
# 3. Create QA chain
qa = RetrievalQA.from_chain_type(
llm=OpenAI(),
chain_type='stuff',
retriever=vector_store.as_retriever()
)
# 4. Query
answer = qa.run("How do I reset my password?")
This is production-level in 2026, not experimental.
Part 13: Environment Setup & Dependency Management Best Practices
Using Conda (Recommended for Data Science)
bash# Create environment with specific Python version
conda create -n datasci python=3.11
# Activate it
conda activate datasci# Install packages pandas numpy scikit-learn jupyter matplotlib
conda install# Create environment file (for sharing) environment.yml
conda env export ># Recreate on another machine create -f environment.yml
conda env
Using pip with Virtual Environments
bashpython -m venv datasci_envsource datasci_env/bin/activate # On Windows: datasci_env\Scripts\activate pandas numpy scikit-learn
pip installpip freeze > requirements.txt # Save versions
Docker for Production
textFROM python:3.11
WORKDIR /app
COPY requirements.txt .
RUN pip install -r requirements.txt
COPY . .
CMD ["python", "app.py"]
This ensures your model runs identically on every machine.
FAQ
1. What's the best way to learn Python for data science as a complete beginner?
Start with Google Colab (free, no setup). Learn Python fundamentals (4 weeks), then NumPy/Pandas (4 weeks), then your first ML model (4 weeks). Build a portfolio project by month 3.
2. Is Pandas or Polars better in 2026?
Pandas remains standard for datasets under 5GB and exploration. Polars dominates for datasets 5GB+ and production pipelines (8x faster, less energy consumption). Learn both.
3. How much do data scientists earn in India in 2026?
Freshers: ₹4–10 LPA. Junior (2–3 yrs): ₹7–15 LPA. Mid-level (3–5 yrs): ₹12–25 LPA. Senior (5+ yrs with GenAI/MLOps): ₹22–75+ LPA.
4. What's the biggest difference between 2016 and 2026 data science?
LLM integration changed everything. Data cleaning now includes LLMs automating preprocessing. Model explainability, code generation, and synthetic data generation are now standard.
5. Can I learn Python data science without a CS degree?
Absolutely. Focus on fundamentals (math, logic), build portfolio projects, and understand production deployment. Many self-taught data scientists earn ₹20+ LPA.
Your Next Steps: Conclusion
The journey from "Hello World" to production data scientist isn't about mastering every library. It's about understanding principles:
- Data quality trumps algorithms. Spend time on cleaning and exploration.
- Vectorization > loops. Pandas and NumPy are fast. Python loops are slow.
- Test/validation matters. Don't trust accuracy on training data.
- Production matters. Notebooks are great for exploration. Models need APIs, versioning, and monitoring.
- LLMs are tools now. Learn to integrate them—they'll handle boilerplate code.
In 2016, a data scientist needed Python. In 2026, you need Python plus MLOps, cloud platforms, and LLM integration.
Your first 90 days: Master Python basics, NumPy, Pandas, and Scikit-learn. Build one real project.
Your next 6 months: Learn FastAPI, Docker, and MLflow. Deploy a model.
Your first year: Integrate LLMs, explore Polars/DuckDB, and understand system design.
By 2027, you'll be commanding ₹15+ LPA—not because you know more libraries, but because you understand how to build systems that solve real business problems.
Start coding. The community, resources, and jobs are waiting.
🚀 Try Codersera Free for 7 Days
Connect with top remote developers instantly. No commitment, no risk.
Tags
Trending Blogs
Discover our most popular articles and guides
10 Best Emulators Without VT and Graphics Card: A Complete Guide for Low-End PCs
Running Android emulators on low-end PCs—especially those without Virtualization Technology (VT) or a dedicated graphics card—can be a challenge. Many popular emulators rely on hardware acceleration and virtualization to deliver smooth performance.

Android Emulator Online Browser Free
The demand for Android emulation has soared as users and developers seek flexible ways to run Android apps and games without a physical device. Online Android emulators, accessible directly through a web browser.
Free iPhone Emulators Online: A Comprehensive Guide
Discover the best free iPhone emulators that work online without downloads. Test iOS apps and games directly in your browser.
10 Best Android Emulators for PC Without Virtualization Technology (VT)
Top Android emulators optimized for gaming performance. Run mobile games smoothly on PC with these powerful emulators.

Gemma 3 vs Qwen 3: In-Depth Comparison of Two Leading Open-Source LLMs
The rapid evolution of large language models (LLMs) has brought forth a new generation of open-source AI models that are more powerful, efficient, and versatile than ever.

ApkOnline: The Android Online Emulator
ApkOnline is a cloud-based Android emulator that allows users to run Android apps and APK files directly from their web browsers, eliminating the need for physical devices or complex software installations.

Best Free Online Android Emulators
Choosing the right Android emulator can transform your experience—whether you're a gamer, developer, or just want to run your favorite mobile apps on a bigger screen.
Gemma 3 vs Qwen 3: In-Depth Comparison of Two Leading Open-Source LLMs
The rapid evolution of large language models (LLMs) has brought forth a new generation of open-source AI models that are more powerful, efficient, and versatile than ever.